

GAZEEKA
Know Your Moisture
We specialise in the design and manufacture of high-precision microwave moisture measurement instruments for the agricultural and mining industries.
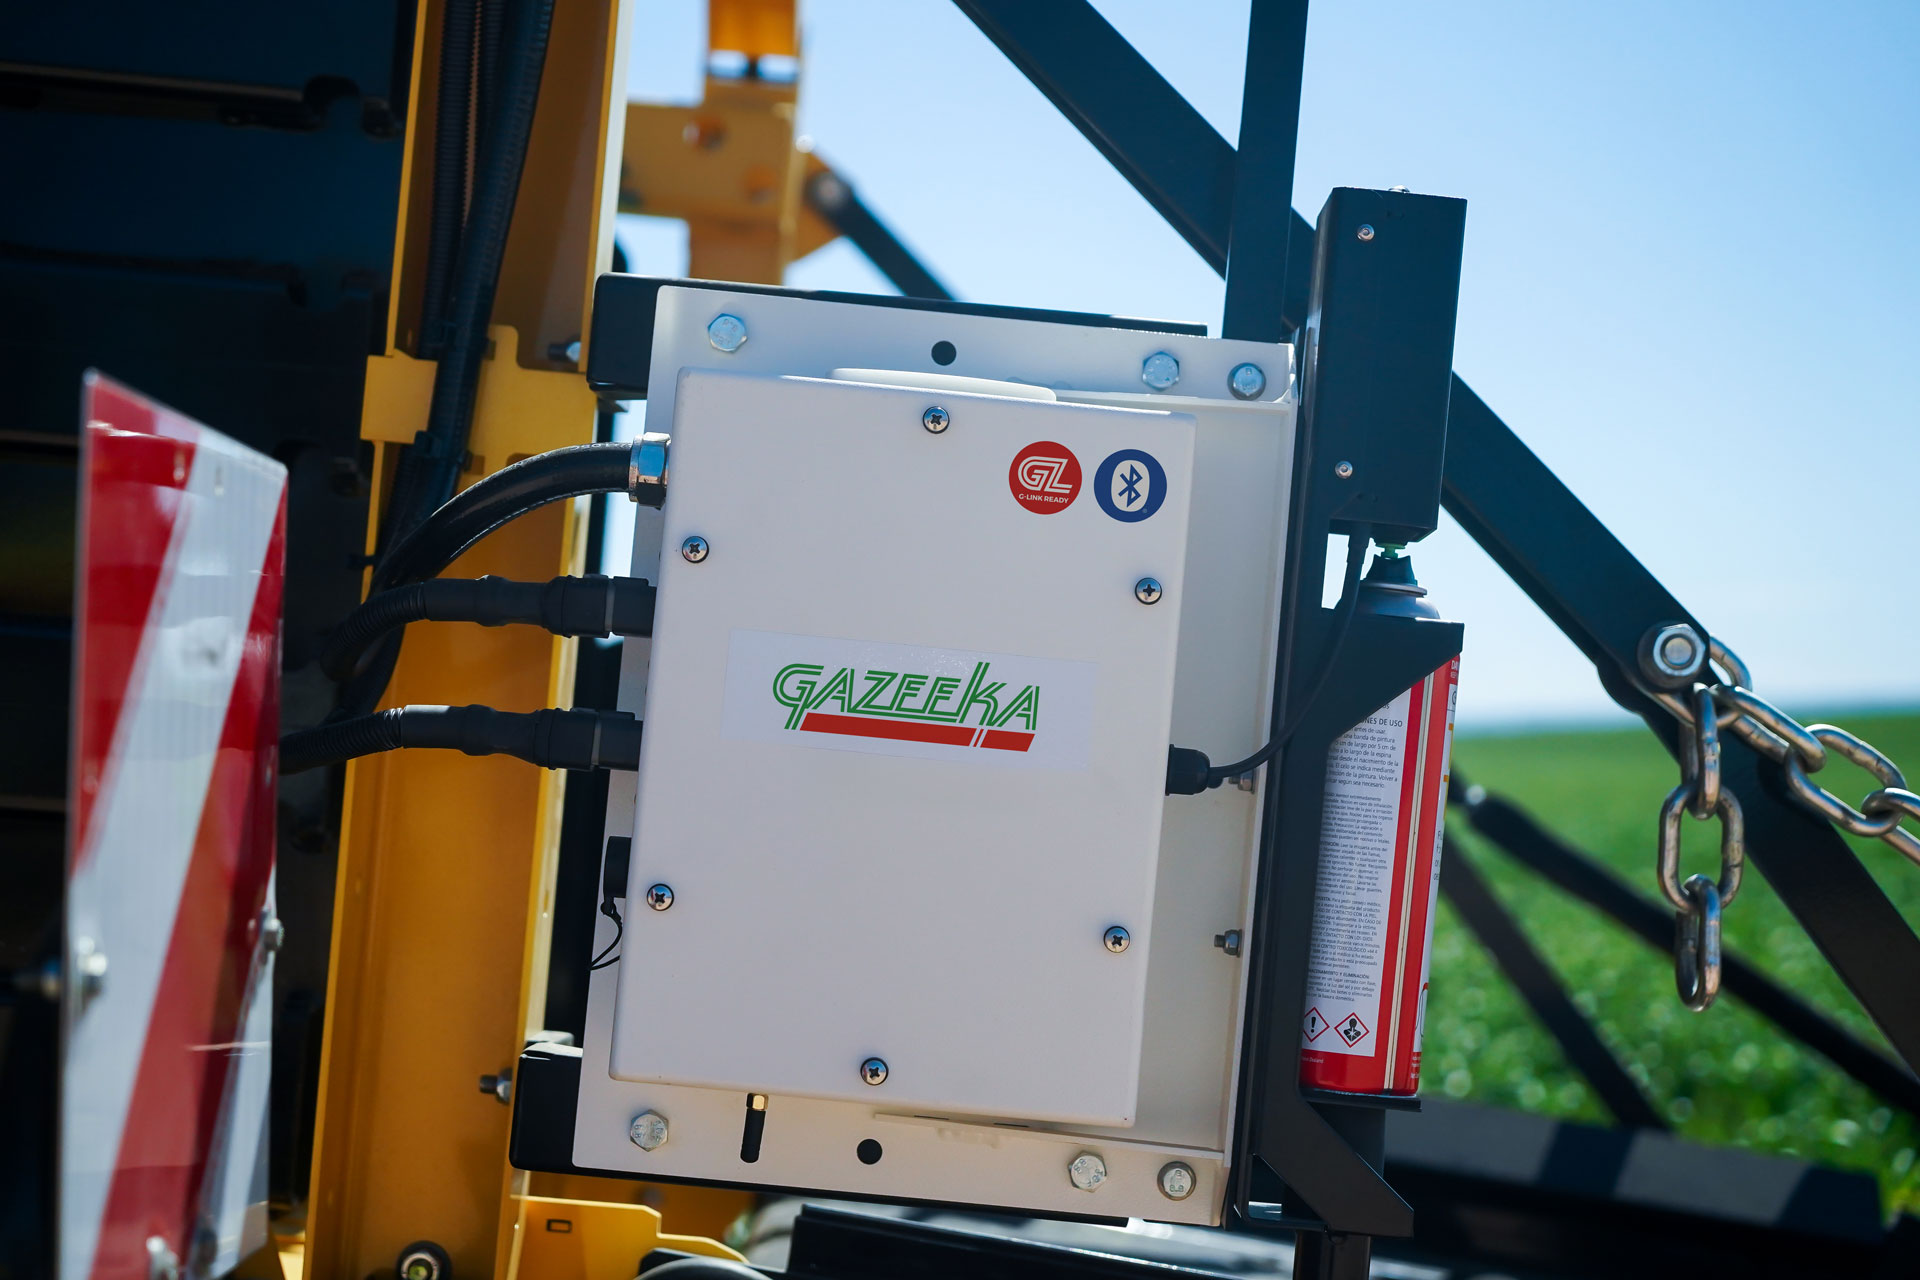
Gazeeka HarvestHub
Take real-time, onsite weather, location and 870 bale moisture data from the field to your phone in an instant. With a multitude of sensors, GPS, cellular connection and MyHay cloud storage, the HarvestHub is purpose built boost your baling efficiency.

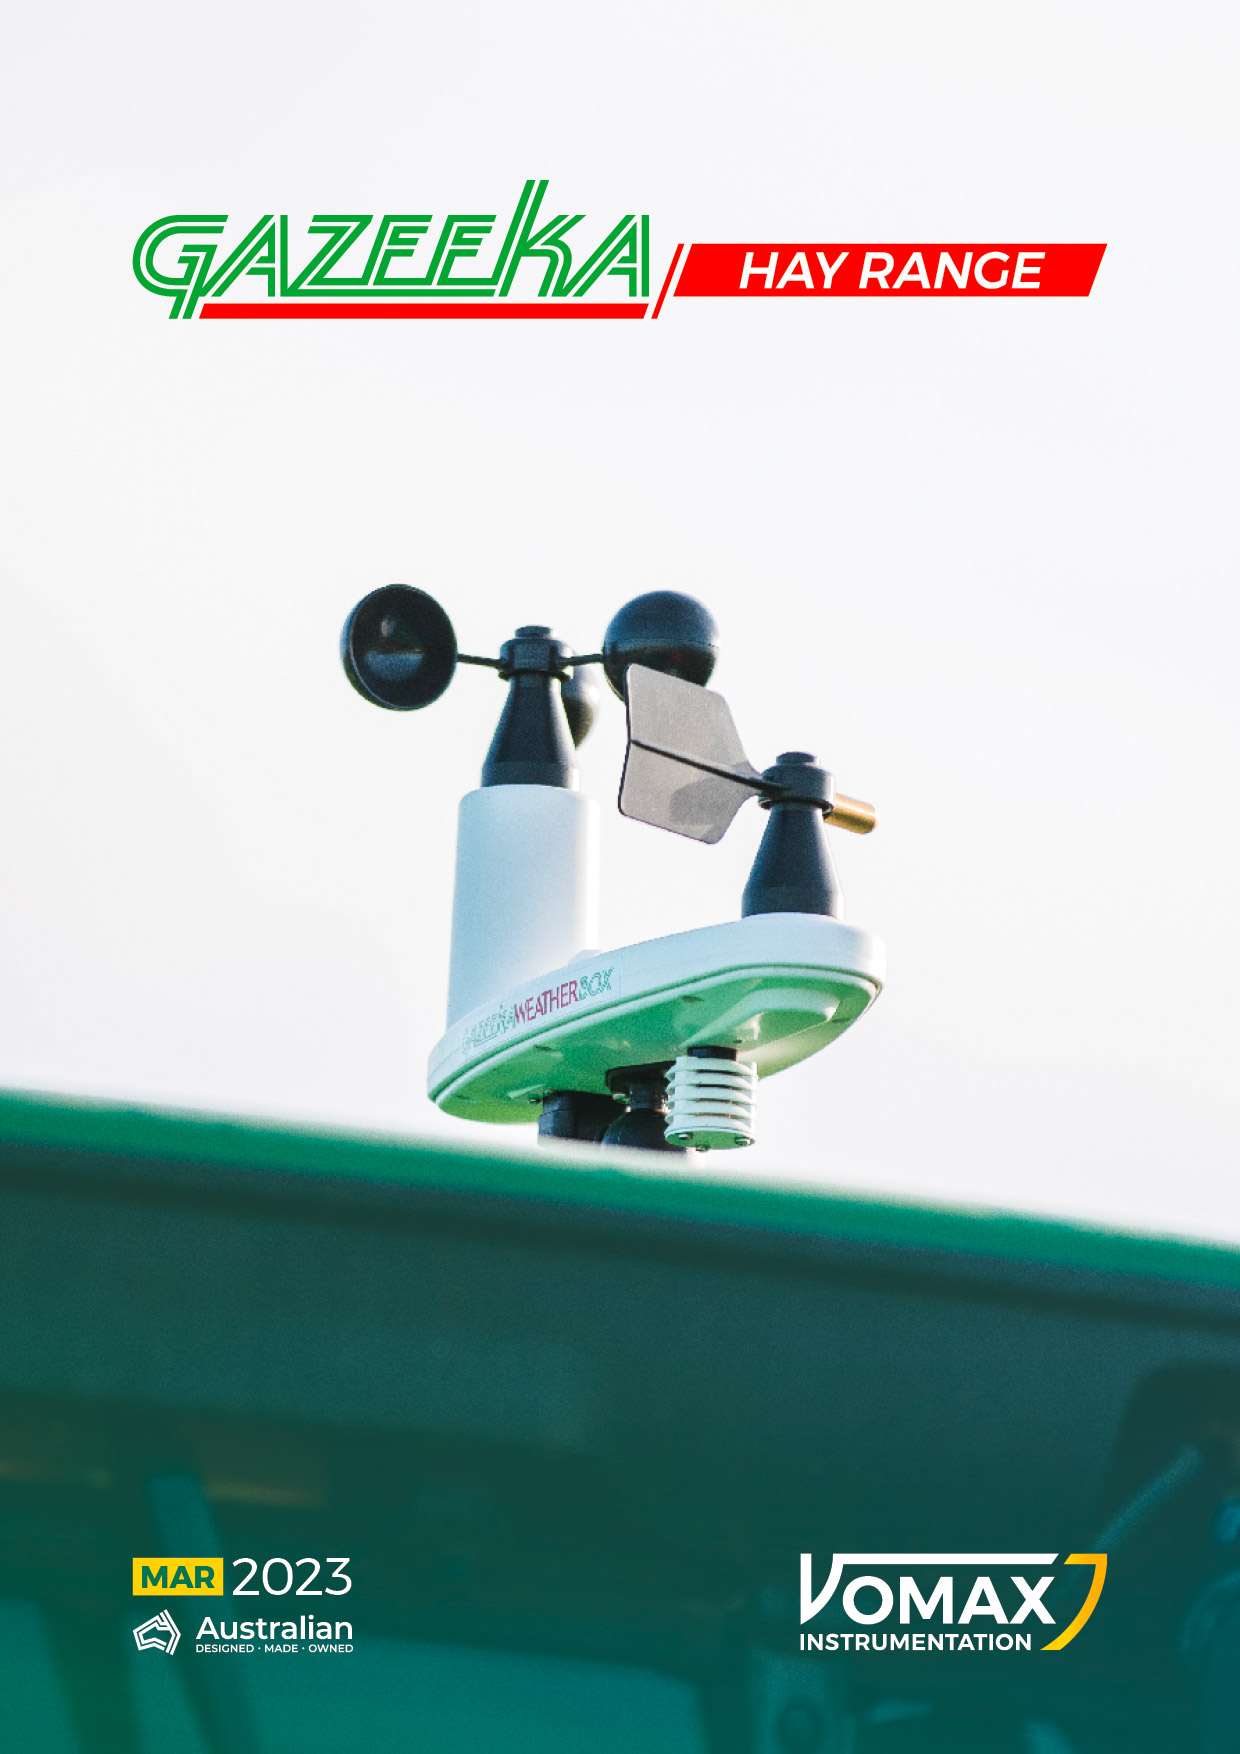
Make better hay with the whole Gazeeka range
For an overview of all the best Gazeeka tech, just flip through or download our latest Hay Range brochure.
Latest News

Grateful for freedom, community, and the moments we share. Happy Fourth of July! 🇺🇸

Happy Father’s Day to the dads…
who spent years following us around turning off lights. 💡
We are grateful for you!
0 CommentsComment on Facebook


The wait is over - the Model 180 is BACK!
Contact us today to learn more about it!
0 CommentsComment on Facebook
For the all the latest updates, follow us on Facebook
0 CommentsComment on Facebook